
Low Insertion Loss, High Power Handling, and Test Data: Why They Matter
Millimeter-wave (MMW) systems often employ isolators to suppress standing waves and achieve optimal performance. Commercial isolators provide good isolation, typically more than 20 dB across full waveguide bands at lower frequencies (under about 85 GHz), and they also tend to have low port reflections. However, at MMW frequencies there is a great divide in performance when it comes to insertion loss, and insertion loss is what matters most.
Why Insertion Loss is Important
It is difficult and expensive to generate MMW signal power. One of the primary goals when designing MMW systems is to minimize loss and preserve signal power. Adding unnecessary loss into a system goes against this fundamental principle. Using an isolator with the lowest possible insertion loss ensures that the maximum output is achieved.
In the case where there is signal power to spare, the lowest loss isolator is still the best choice. The RF source can simply be “turned down”. This lowers the operating temperature, increases the mean time to failure, and decreases power consumption. Conversely, when an isolator with high insertion loss is used, the signal source must be driven harder to overcome the loss. The system runs hotter, fails more quickly, uses more power, has higher noise, and generates more harmonic content.
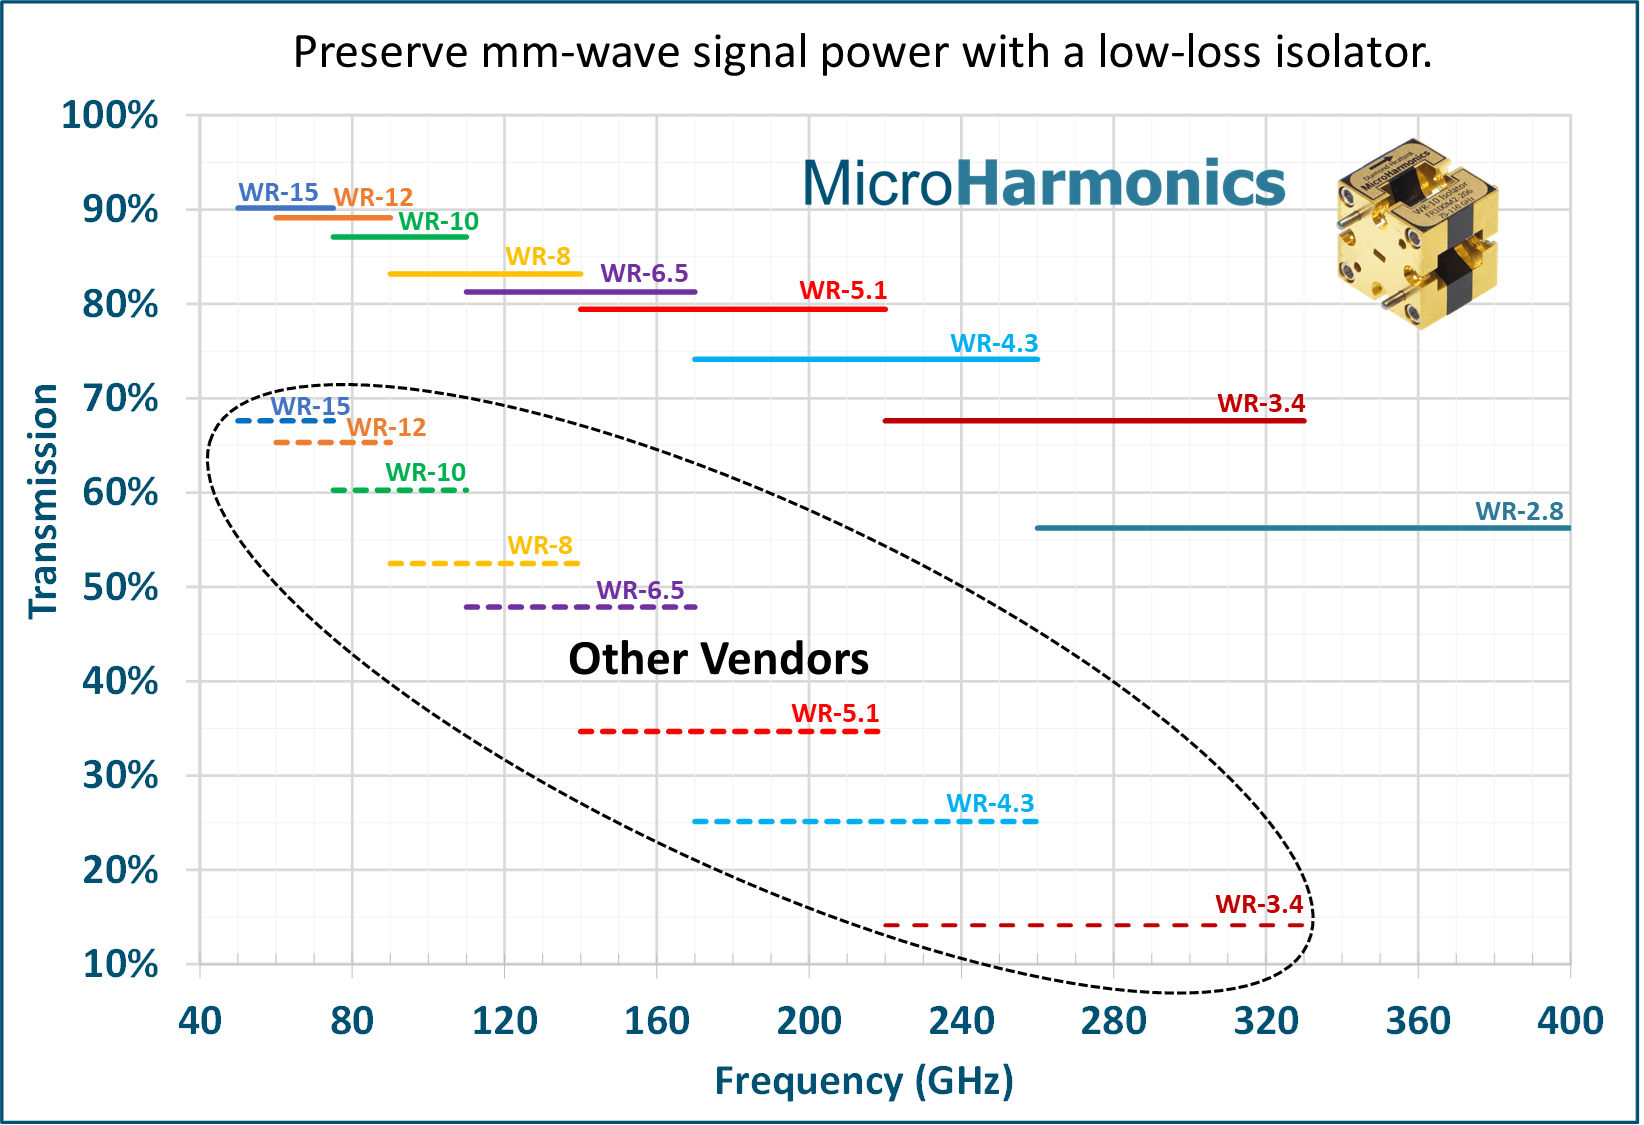
The isolators produced by Micro Harmonics Corporation have the lowest insertion loss in the industry, by a wide margin. For example, in the WR-4.3 band 170-260 GHz, the typical insertion loss of an Micro Harmonics isolator is 1.5 dB while that of competitor products is more than 6 dB. The Micro Harmonics isolator passes 71% of the signal while the other isolators pass only 25% (see the graph below). Such high loss should never be tolerated in an MMW system if it can be prevented.
Lower-cost isolators with higher insertion loss exist on the market. However, using a higher loss isolator may actually significantly increase costs rather than lower them. The added loss will reduce the signal power and make it more difficult to meet your specification. This can lead to missed deadlines and many additional hours of tuning and testing. In the end, the application may require more power than was originally budgeted. The unanticipated costs can far outweigh any initial savings. It does not make sense to degrade the performance of an expensive MMW system to achieve a marginal cost reduction.
Power Handling
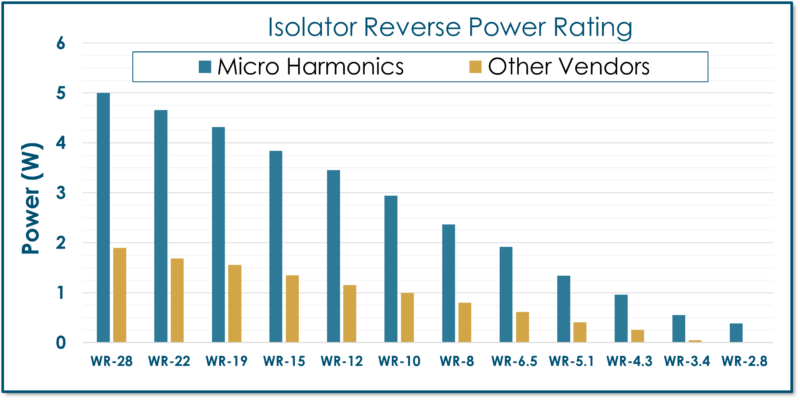
Micro Harmonics isolators employ a unique diamond heatsink that substantially lowers the internal temperature. This means that our isolators can handle more power while operating at much lower temperatures when compared to competitor products. No other vendor offers this.
The graph below shows the maximum reverse power ratings of our isolators and the average of other vendors. The Micro Harmonics power ratings are conservative to ensure low temperatures and long life.
RF Test Data
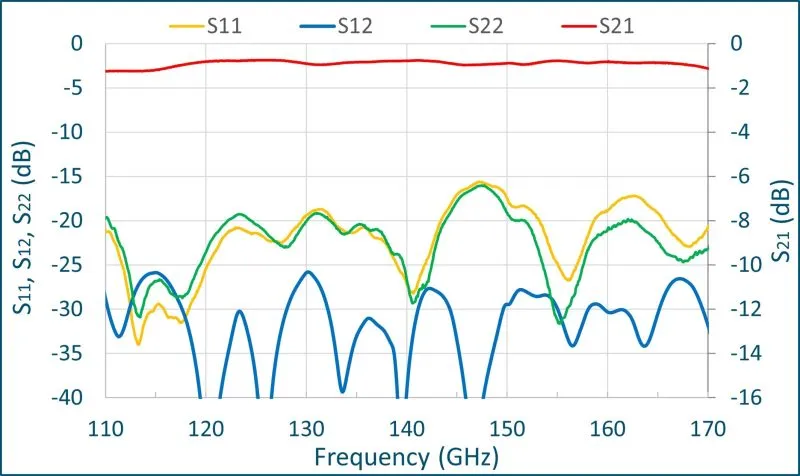
No two MMW isolators have the same exact frequency response. Unique signatures arise from small misalignments and variations in the internal parts. The differences can be substantial. Max, min, and typical specs are helpful, but what you need to see is the actual test data for the isolator you are buying. Micro Harmonics tests every isolator across the full waveguide band on a vector network analyzer. We supply the test data to our customer at no additional cost. Don’t settle for anything less.
The following chart is an example of actual test data from a WR-6.5 isolator.
Micro Harmonics Corporation produces the most advanced isolators in the world. Join the growing number of engineers and scientists across the globe who are using our isolators to unlock the full potential of their MMW and terahertz systems. If you have any questions regarding our isolators, circulators, or attenuators, feel free to contact us! We are here to help.